LIDAR Based Sign Detection with ROS and PCL
In one of my first undergraduate projects, I created a sign detection package for ROS-kinetic to detect stop-signs from a Velodyne VLP-16 LIDAR. There’s been some interest, so I’ve decided to post a basic write-up and the source code!
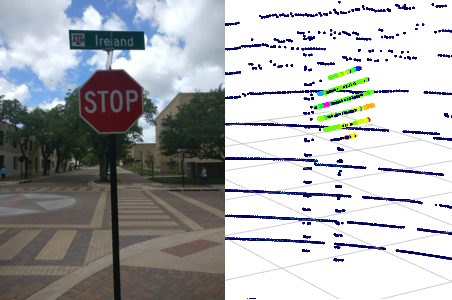
In Action Demo
Source Code
If you’re interested in the source code, I’ve provided it on Github. Feel free to fork it and submit a pull request if you have any improvement ideas!
Background
LIDAR Sensors
LIDAR sensors typically output a point-cloud of XYZ points with intensity values. Intensity values correlate to the strength of the returned laser pulse, which depend on the reflectivity of the object and the wavelength used by the LIDAR 1. Since signs are required to have a reflective material for night time driving, we can use this property to our advantage when discriminating point clouds for signs.
For more information on sign reflectivity standards, see ASTM D4956.
Velodyne VLP-16
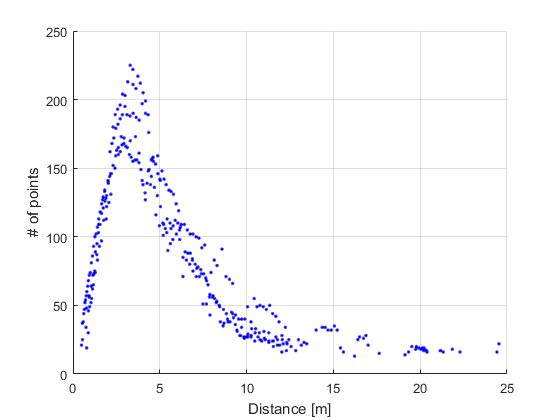
The Velodnye VLP-16 is now a very popular and relatively economical LIDAR sensor. Although it offers 300,000 points per second, I found that I could only reliably detect stop signs from up to 10 meters away with it mounted about 2 meters high.
Below you can see a plot representing the amount of detected points on a stop-sign versus detection distance:
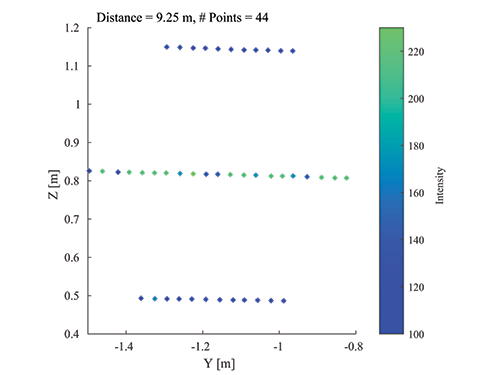
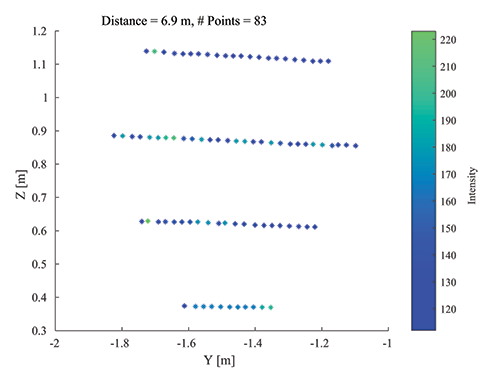
And below you can see the number of detected points at 9.25 and 6.9 meters from left to right:
Algorithm
The algorithm scheme is broken up into five stages, shown by the flowchart below:
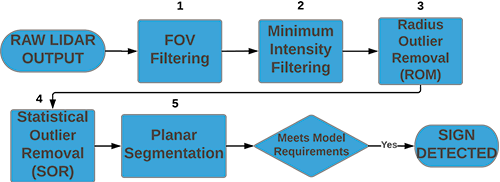
Stage 1 - FOV Filtering
In this stage, an elementary Field of View (FOV) filter is applied to the dataset to reduce 50% of the point cloud. This process step removes any data behind the LiDAR, and any data outside a \(\pm\) 10 meter side clearance . Performing initial geometry based filtering alleviates computational expenses in subsequent processes.
Stage 2 - Minimum Intensity Filtering
The next processing step applies a minimum intensity threshold on the dataset to further reduce the point cloud. Again. measured intensity values are relative to the LiDAR model/calibration and thus, calibration is necessary for determining a suitable minimum intensity value. Signs tested with the VLP-16 included Types I-IV specified by ASTM D4956 in the United States. An effective minimum intensity value of 85 was determined for day time operation.
Stage 3 - Radius Outlier Removal
Returned points for a sign should be in close proximity within another; stop signs typically have a diameter of 0.75 m. This stage performs implements a PCL function, RadiusOutlierRemoval which iteratively removes points that contains less than 3 neighbors in a 0.5 m radius.
Stage 4 - Statistical Outlier Removal
Stage four implements a PCL function, StatisticalOutlierRemoval, to reduce further data noise and random scatter from LiDAR output.
Stage 5 - Planar Segmentation
The last process also implements a PCL function,, which returns the indices of inlier points that exists on plane models within allowable tolerances. The function uses a RANSAC method to segment points, and coefficients of the plane model \(\textbf{n} = (a,b,c)\) are also returned . The assumption made during this process is that any points that exist along the street sign should lay on a plane.
Closing Comments
This was my first project to get my feet wet with Self-Driving cars, and hence may be pretty basic. For instance, a license plate (which usually faces normal to the vehicle and is reflective) may probably be detected as a sign. I may take up some future work with this program which includes:
- Once a potential sign has been detected, also traverse downwards to see if there are any points hitting the pole
- Feed this filtered pointcloud data into a neural-network and attempt to classify the sign type (or whether it is a sign at all)
- Generate a Region of Interest (ROI) from the LIDAR points, and use a camera to classify the sign (or whether it is a sign at all)
Citing:
@misc{neel2019autonomous,
    title={Autonomous Shuttles for Last-Mile Connectivity},
    author={Garrison Neel and Amir Darwesh and Quang Le and Srikanth Saripalli},
    year={2019},
    eprint={1910.04971},
    archivePrefix={arXiv},
    primaryClass={cs.RO}
}
References
-
ArcGIS – “What is lidar intensity data?“ ↩